The number Study 01 could not give you
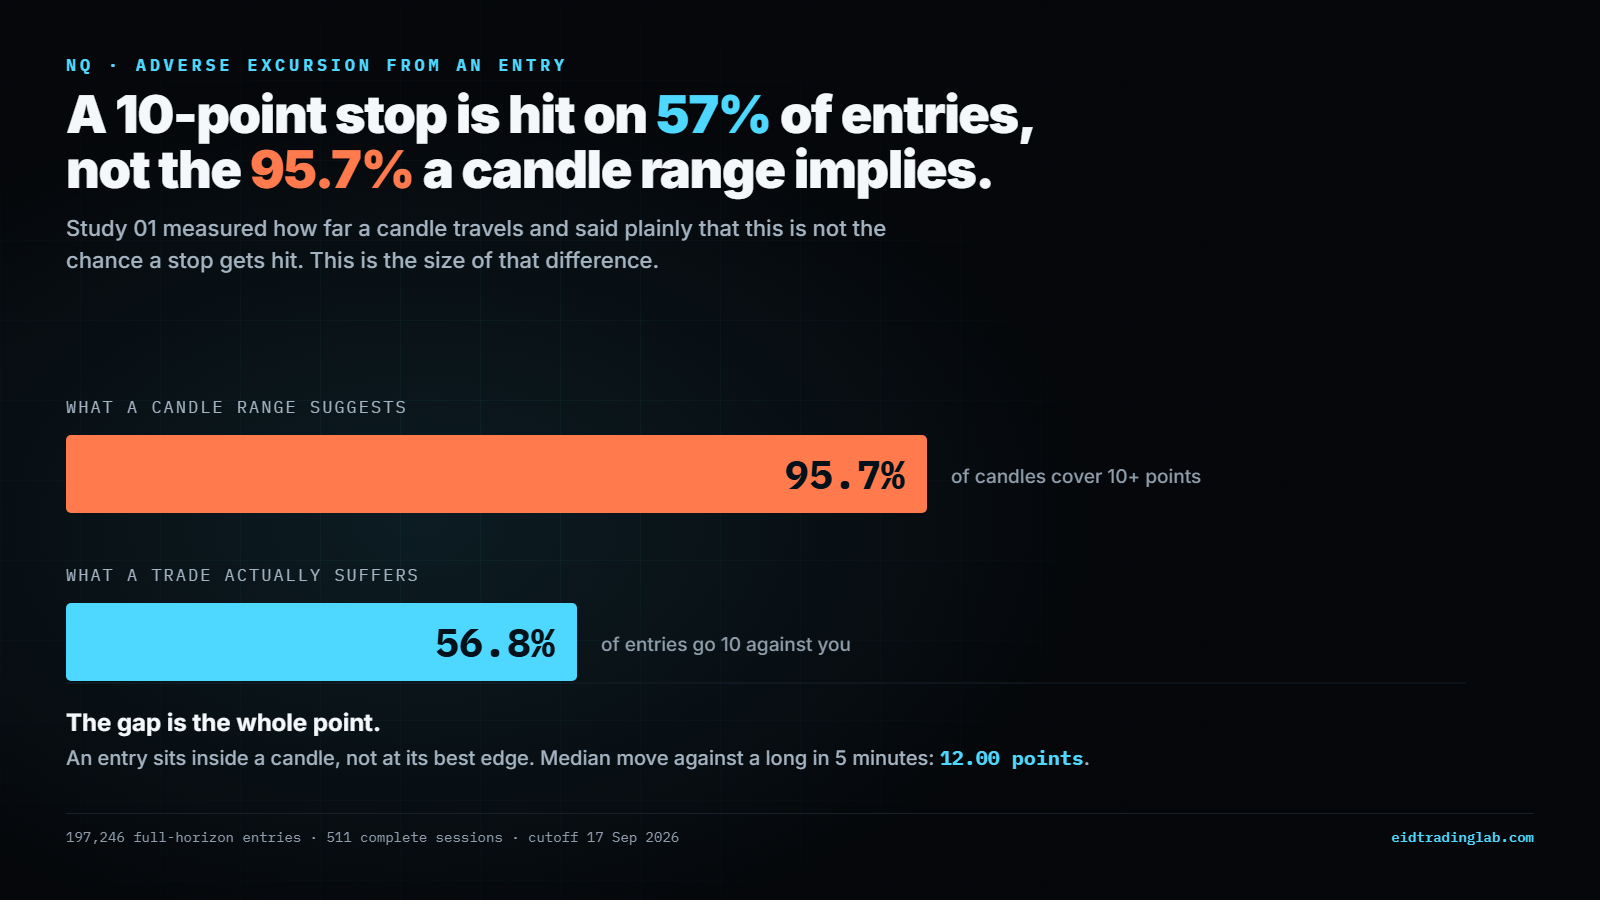
We published that 95.7% of five-minute NQ candles cover more than ten points, and immediately warned that this is not the chance a ten-point stop gets hit. An entry sits somewhere inside a candle rather than at its best edge, and a candle that travels twenty points can leave a particular trade untouched. That warning was correct, and here is the size of it.
Nearly forty percentage points separate the two. Anyone who had taken the first figure as a stop-loss probability would have been badly wrong, which is exactly why it was published with its limits attached.
points. The median distance NQ moves against a long entry within five minutes, across 197,246 entries taken at the open of every minute of the US cash session that had five whole minutes of the same session left to run.
A ten-point stop therefore sits below the middle of what an ordinary trade endures in its first five minutes. Not far below, and not in every hour, but below. That is a more useful sentence than anything a candle range can support.
How it was measured
An entry is taken at the open of every minute between 09:30 and 15:59. Adverse excursion is the worst the position ever stood within the horizon, measured from the entry price: for a long, how far price fell below it; for a short, how far it rose above it. Long and short are kept separate rather than assumed symmetric.
Every horizon here is a full horizon. An entry counts toward the five-minute measurement only if five whole minutes of the same session follow it, and toward the thirty-minute race only if thirty do. An entry at 15:50 is not given ten minutes and then reported as though it had thirty. Of the 199,290 minutes in the sample, 197,246 qualify at five minutes and 184,471 at thirty.
This is deliberately the worst case an entry could have faced. It is not a strategy, there is no signal, and no attempt is made to pick a good moment. That is the point: it describes what the market does to an arbitrary entry, which is the floor any timed entry has to beat.
Longer horizons are worse, and not proportionally
NQ, long entries. Distance in points that price moved against the position.
| Within | Median | 90th percentile | 95th percentile |
|---|---|---|---|
| 1 minutes | 5.25 | 18.25 | 24.75 |
| 5 minutes | 12.00 | 41.00 | 55.75 |
| 10 minutes | 17.00 | 58.25 | 78.75 |
| 15 minutes | 20.75 | 71.00 | 95.25 |
| 30 minutes | 29.25 | 99.75 | 134.75 |
Six times the horizon gives roughly five times the median excursion, so it does not scale linearly, but the tail grows faster than the middle. At thirty minutes the ninetieth percentile is 99.75 points, which is about 3.6 times the median range of a single five-minute candle.
Where the stop actually sits, by size
How often price moved at least this far against the entry within five minutes.
| Distance against the entry | Long entries | Short entries |
|---|---|---|
| 4 points | 81.2% | 81.5% |
| 6 points | 72.4% | 72.4% |
| 8 points | 64.2% | 63.9% |
| 10 points | 56.8% | 56.2% |
| 15 points | 41.8% | 40.5% |
| 20 points | 31.1% | 29.4% |
| 25 points | 23.4% | 21.6% |
| 30 points | 17.8% | 16.0% |
Long and short come out within about a point and a half of each other at every level, so over this period NQ was close to symmetric in how it punished an arbitrary entry. That is worth stating because it is often assumed rather than checked.
The race a stop actually runs
Adverse excursion on its own still answers only half the question. A trade does not just suffer, it also has somewhere to get to, and what decides a fixed stop and target is which one price reaches first. So the same entries were run as a race: place a stop and a target at the same moment, give it thirty full minutes inside the same session, and record which was touched first.
One honesty problem has to be dealt with before any of these numbers mean anything. If a single one-minute bar touches both the stop and the target, its open, high, low and close do not say which came first. We do not have the tick sequence for the whole window, so we do not guess. Those cases are counted in a category of their own and published, rather than assigned to whichever side would make the table look tidier.
| Stop and target | Target first | Stop first | Same minute, unresolved | Neither | Stop first, of those decided | Idealised symmetric-barrier benchmark |
|---|---|---|---|---|---|---|
| 10 point stop, 10 point target | 46.7% | 47.8% | 5.3% | 0.2% | 50.5% | 50.0% |
| 10 point stop, 20 point target | 31.0% | 65.2% | 1.7% | 2.0% | 67.8% | 66.7% |
| 10 point stop, 30 point target | 21.4% | 72.7% | 0.8% | 5.1% | 77.2% | 75.0% |
| 15 point stop, 30 point target | 27.6% | 62.9% | 0.5% | 9.0% | 69.5% | 66.7% |
| 20 point stop, 40 point target | 23.3% | 58.2% | 0.2% | 18.3% | 71.4% | 66.7% |
| 25 point stop, 25 point target | 41.8% | 44.3% | 0.3% | 13.5% | 51.5% | 50.0% |
The symmetric race is the sanity check. With the stop and the target the same distance away, an arbitrary long entry reaches the target first 46.7% of the time and the stop first 47.8%, with 5.3% unresolved inside a single minute. Of the races that were decided, the split is 49.5% against 50.5%. The near-symmetry is a useful sanity check: with equal barriers and no directional edge, roughly equal first-touch rates are what we would expect. A real market need not deliver exactly fifty fifty, since drift and serial dependence are both possible, but a result far from it would have pointed at a bug in the measurement rather than at a discovery.
The important caveat, before the asymmetric rows are read
A stop that sits closer than the target is reached first more often in any symmetric price path. That is geometry, not a statement about stops. With a ten-point stop and a twenty-point target, a driftless symmetric walk that must eventually hit one of them reaches the nearer one two times in three, because the far barrier is twice the distance away. That is an idealised benchmark rather than a law. This study has a thirty-minute limit, races that finish undecided, minute bars rather than ticks, and a category that cannot be resolved at all. The last column is a reference point, not a figure the data is obliged to match. So the honest question is not whether the stop wins more often. It is whether it wins more often than distance alone accounts for.
The last two columns above answer that, and the answer is close to no. Of the ten against twenty races that resolved, the stop came first 67.8% of the time, against the 66.7% the idealised benchmark gives. Three to one resolves at 77.2% against a benchmark of 75.0%. Over this period, and for an entry taken at an arbitrary minute, the race outcome sits close to what the distances alone would suggest. Close, not identical: at twenty against forty the stop wins rather more often than the benchmark, which is worth noticing rather than smoothing over.
Two things follow, and neither is the thing traders usually take from a table like this.
- This is not evidence that a two to one target is a bad ideaLosing roughly two races in three at two to one is close to break-even before costs, which is precisely what an entry with no information should produce. If your own numbers look like this table, the problem is not the ratio, it is that the entry is not adding anything.
- It is not evidence that the ratio works eitherNothing here measures expectancy. Costs are ignored entirely, the unresolved and undecided cases are not free, and a real trade does not close itself at a barrier the instant it is touched.
What the table does establish is a floor. An entry that carries no information behaves the way distance alone says it should. Any method worth its screen time has to beat that, and now there is a published number to beat rather than a feeling.
Short entries behave the same way
Run identically, a short entry at ten against twenty reaches its stop first 63.9% of the time against the long side's 65.2%. Across every pair the two sides sit within about two points of each other, so over this period NQ treated an arbitrary long and an arbitrary short close to identically. That is worth measuring rather than assuming, which is why both were run.
What the trade had available
The same entries, measured in the favourable direction. Within five minutes the median long entry saw 11.75 points in its favour at some point, against 12.00 points against it. The two are close, which is the whole reason a stop inside that band is a coin toss dressed up as risk management.
How much of this is chance
197,246 entries is not 197,246 experiments. An entry at 10:01 and an entry at 10:02 travel almost the same path, so treating them as independent observations would make every figure here look far more precise than it is. The honest unit is the session. Resampling whole sessions 400 times gives:
- A ten-point stop reached within five minutes: 56.8%, with a 95% interval of 55.5% to 58.0%.
- The stop reached first in a ten against twenty race: 65.2%, with a 95% interval of 64.6% to 65.8%.
Read every headline on this page as roughly a point either side, not to two decimal places.
The hour matters more than the stop size
NQ, long entries, five-minute horizon, by half hour.
| Entry time (New York) | Median against | 90th percentile | Reached 10 points |
|---|---|---|---|
| 09:30 | 22.75 | 67.75 | 75.4% |
| 10:00 | 18.25 | 57.25 | 70.8% |
| 10:30 | 16.25 | 49.00 | 67.2% |
| 11:00 | 13.25 | 42.00 | 60.6% |
| 11:30 | 12.00 | 38.75 | 57.7% |
| 12:00 | 11.00 | 34.25 | 53.8% |
| 12:30 | 10.50 | 34.75 | 52.0% |
| 13:00 | 10.25 | 32.50 | 51.1% |
| 13:30 | 9.75 | 32.00 | 49.4% |
| 14:00 | 9.75 | 31.25 | 49.1% |
| 14:30 | 9.25 | 32.00 | 47.7% |
| 15:00 | 9.50 | 31.00 | 48.2% |
| 15:30 | 11.25 | 36.75 | 55.1% |
An entry at the open faces a median adverse excursion of 22.75 points; the same entry at 14:30 faces 9.25. A ten-point stop is reached 75.4% of the time in the first half hour and 47.7% of the time in the early afternoon. The same stop is a different instrument depending on when it is used, and the gap between those two figures is larger than the gap between a ten-point and a fifteen-point stop at a fixed hour.
And the day before matters too
Sessions are split into three equal groups by the previous session's high-to-low range, so the label uses only information that existed before the entry. The tercile boundaries themselves are drawn across the whole sample and are therefore ex post, which makes this a stratification of the data rather than a rule anyone could have run live without knowing the rest of the period. Quiet means the previous session ranged under 240.25 points, busy means over 366.00.
| Previous session | Median against | 90th percentile | Reached 10 points |
|---|---|---|---|
| Quiet | 9.25 | 30.75 | 47.7% |
| Ordinary | 11.50 | 37.00 | 55.7% |
| Busy | 16.25 | 54.00 | 67.0% |
The same ten-point stop is reached 47.7% of the time after a quiet day and 67.0% after a busy one. Yesterday is not a forecast, but it is information you already have before you place anything.
ES, for comparison
The median adverse excursion on a five-minute ES long is 2.50 points, and a two-point stop is reached 59.0% of the time. The shape is the same; the scale is not.
What this does not prove
- It is not a probability that your stop gets hitIt is the probability for an entry taken at an arbitrary minute with no reason behind it. If your entries are timed on something real, your numbers should be better than these, and this is the baseline to beat rather than the result to expect.
- It says nothing about whether the trade would have workedAdverse excursion measures only the pain, never the outcome. A trade that goes fifteen points against you and then a hundred in your favour appears here only as fifteen points of damage.
- It ignores costs and fills entirelyEntry is the open of a minute, exactly. No spread, no slippage, no commission.
- It describes 23 June 2024 to 17 September 2026Volatility regimes change. The by-regime table exists precisely because the overall figure hides that.
- A wider stop is not freeNothing here argues for one. A stop that is hit less often costs more when it is hit, and position size has to answer for that. This measures one side of that trade only.
Method
- Data cutoff: 17 Sep 2026Versioned and frozen, like every study here.
- DataTrade ticks exported through Quantower for XCME-listed instruments, aggregated into one-minute bars by our own code. The methodology page carries the chain and where it stops.
- SessionsComplete US cash sessions only, all 390 minutes from 09:30 to 15:59 present, the same rule as Study 02. 511 NQ and 493 ES sessions.
- HorizonsAn entry counts toward a horizon only when the entire horizon fits inside the same session. Nothing is truncated at the close and then reported as though it were not.
- UncertaintyEstimated by resampling whole sessions, because minute entries overlap and are not independent observations.
- EntriesOne at the open of every minute of every session, 199,290 minutes on NQ.
- HorizonsAn entry counts toward a horizon only when the whole horizon fits inside the same session. Nothing is truncated at the close and then reported as though it were not. 197,246 entries qualify at five minutes, 184,471 at thirty.
- UncertaintyEstimated by resampling whole sessions, because minute entries overlap heavily and are not independent observations.
- ExcursionMeasured on the one-minute bars within the horizon: the lowest low for a long, the highest high for a short, against the entry price. Intrabar order is not known, so a bar that contains both the worst point and a recovery counts as the worst point.
- RegimeTerciles of the previous session's range. The label never uses the same day, but the tercile cuts are drawn across the whole sample, so the split is ex post stratification rather than a rule you could have run live.
- Auditable, and reproducible as far as it can beThe pipeline is published:
mae.pyproducesmae_v1.json, and both are below. What is not published is the raw bars, which the lab is not licensed to redistribute, so an outside reader can check every step of the logic and re-run the analysis on their own one-minute data, but cannot reproduce these exact figures from ours. That is the honest limit of it. - FrozenStudy 03 is v1.
mae.pysha25685c280b5f8a0d48d,mae_v1.jsonsha2562888bd568ccc99cf, first 16 characters. A change to either is published as a new version, never as a quiet edit.
What happened to a stop like yours
Every combination offered here is one the study actually measured. Pick the pair closest to how you trade and the half hour you enter, and it gives you the measured split, the benchmark a coin with those distances would produce, and the distance price ran against entries at that hour.
What that means for your account
This tells you what price did. The free check tells you what it costs: your stop, your account and the room one trade takes out of it, next to the measured range of a candle.
Risk & Drawdown Playbook
Knowing how often a stop is reached is one piece. The kit puts it beside the rules that decide whether your account survives being right slowly: both ceilings, every drawdown variant, your numbers.