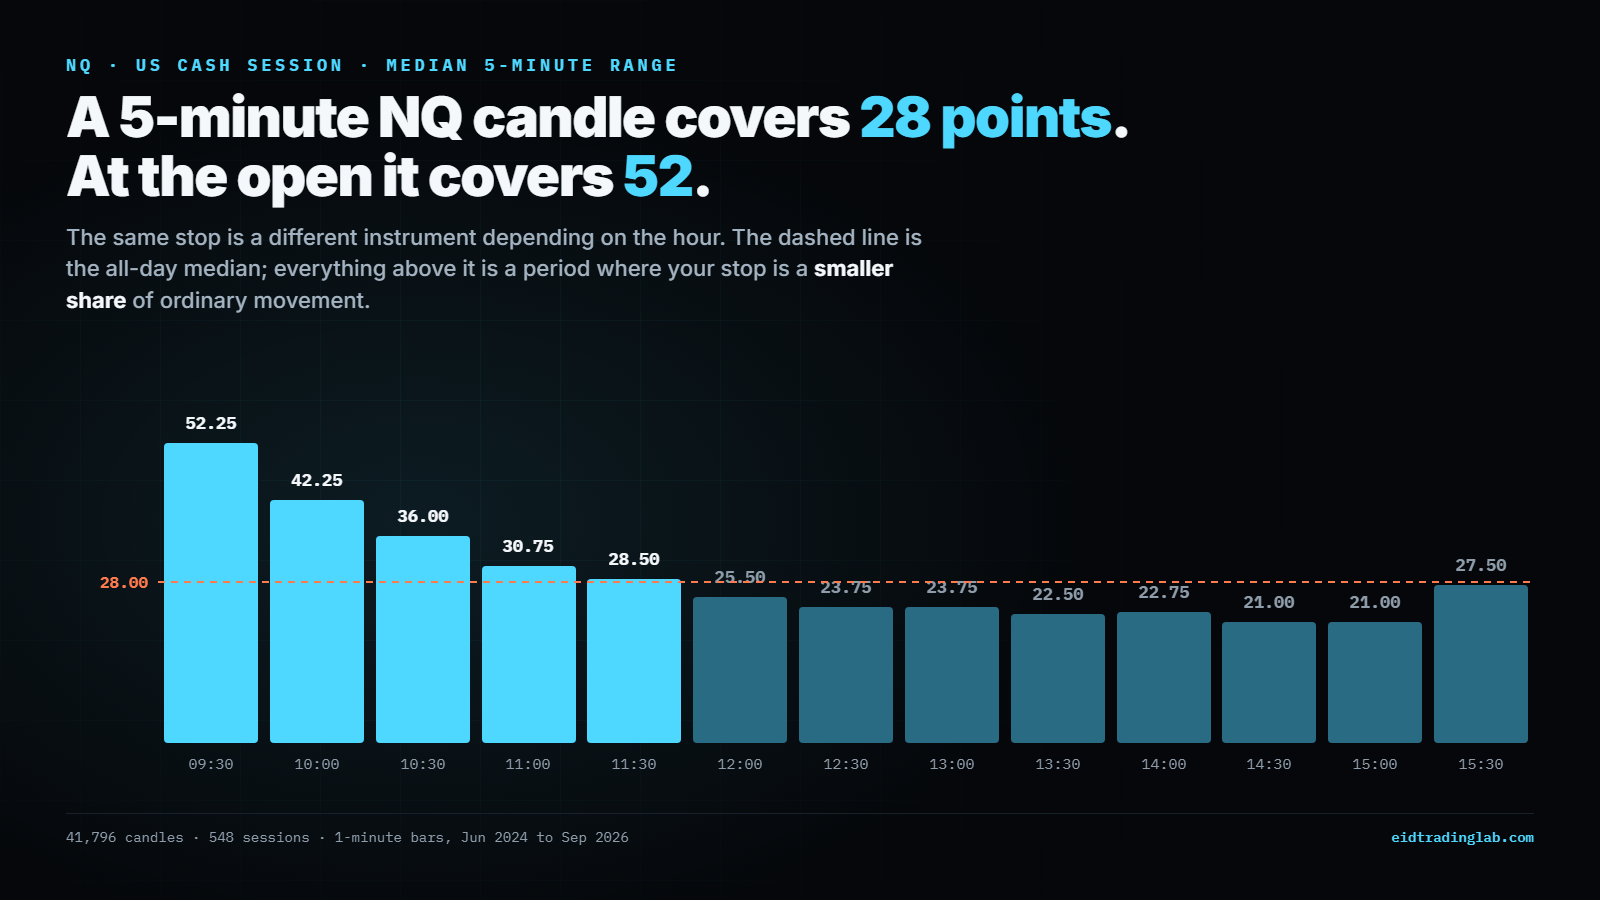
The answer first
Half of all US cash-session 5-minute NQ candles travelled more than 28 points from their own high to their own low. Half travelled less. On ES the same measurement is 5.75 points.
Line up every 5-minute candle from the smallest move to the largest. The one in the middle covered 28 points. That is the median.
It is deliberately not an average. A handful of CPI mornings pull an average upward until it describes no ordinary session at all, the average here is 35.23 points, which is 26% higher than the middle of the distribution. The median stays where most candles actually are.
How often a candle covers more than X
The median is one point on a distribution. The rest of it is more useful than the headline number, because it answers the question a trader actually has: how often does price cover the distance I am giving it?
| A 5-minute NQ candle covers more than… | Share of candles |
|---|---|
| 4 points | 99.9% |
| 8 points | 98.3% |
| 10 points | 95.7% |
| 15 points | 83.9% |
| 20 points | 69.9% |
| 30 points | 45.7% |
On ES: more than 2 points in 95.5% of candles, more than 4 points in 69.9%, more than 6 points in 46.1%.
A 10-point NQ stop is smaller than the range covered by 95.7% of individual five-minute candles.
That sentence is a measurement, and it is worth being precise about what it is not. It does not say that 95.7% of 10-point stops get hit. An entry sits somewhere inside a candle's range rather than at its best edge, and the direction of the move matters. What the figure does say is that the distance is small relative to how far price ordinarily travels inside a single candle, which is not what "tight" usually implies to the person saying it.
The range is not the same all day
Splitting the same measurement by half-hour block changes the picture again. Median high-to-low range of a 5-minute candle, by time of day:
| Time (ET) | NQ | ES |
|---|---|---|
| 09:30 | 52.25 | 9.00 |
| 10:00 | 42.25 | 8.00 |
| 10:30 | 36.00 | 7.00 |
| 11:00 | 30.75 | 6.00 |
| 11:30 | 28.50 | 5.75 |
| 12:00 | 25.50 | 5.25 |
| 12:30 | 23.75 | 5.00 |
| 13:00 | 23.75 | 5.00 |
| 13:30 | 22.50 | 4.75 |
| 14:00 | 22.75 | 4.75 |
| 14:30 | 21.00 | 4.50 |
| 15:00 | 21.00 | 4.75 |
| 15:30 | 27.50 | 6.25 |
The median range at 14:30 is 40% of the median range at the open. A stop of a given size is therefore a completely different proposition depending on the clock, 25 points is 48% of the median 5-minute range at 09:30 and 119% of it at 14:30. Same number of points, opposite meaning.
This is the part that makes "I always use a 20-point stop" difficult to defend as a rule. It is not that the number is wrong; it is that the same number is doing two different jobs at two different hours.
For context: the whole day
The median full-session range, high to low across the entire regular session, is 287.12 points on NQ and 59.50 points on ES. By weekday, the NQ median session range runs from 260.25 points on Mondays to 309.25 on Thursdays.
Method
- Data cutoff: 17 Sep 2026This study is versioned. Every figure on this page was computed from a frozen snapshot ending at that date, and the numbers do not move as new bars arrive. Published research here is updated deliberately, as a new version with its own cutoff, not continuously.
- DataTrade ticks exported through Quantower for XCME-listed NQ and ES instruments, aggregated into one-minute bars by our own code; recent days come from the desk’s own live recordings. The chain, and where it stops, on the methodology page. 747,455 NQ one-minute bars (23 Jun 2024 to 17 Sep 2026) and 716,615 ES one-minute bars (14 Jul 2024 to 31 Jul 2026). Front-month bars as recorded by our data pipeline; contract rolls are not back-adjusted, which does not affect these figures because every measurement here is an intraday range.
- DeduplicationThe raw NQ files contained 809,970 rows, of which 61,861 shared a bar timestamp already present. Seven timestamps in the whole dataset carry copies that actually disagree, and none of them falls inside 09:30 to 16:00, so the rule cannot have moved any figure here. The rule applied: rows sharing an identical bar timestamp (epoch milliseconds) are collapsed and the first occurrence is kept, leaving 747,455 unique bars. The same rule was applied to ES, where it removed nothing, the export contained no duplicate timestamps.
- SessionThe US cash session, 09:30 to 16:00 New York, which is the window most day traders work. NQ itself trades on CME almost around the clock, so this is a chosen window rather than the instrument’s own trading hours. Overnight is excluded entirely, including it roughly halves the figures and describes hours most day traders never trade. That single choice is the difference between a median of 28.00 and one of 15.75.
- Candle range5-minute candles built from the one-minute bars; range is high minus low of each candle. 41,796 NQ candles across 548 sessions and 40,087 ES candles across 523 sessions fall inside the window. A candle does not need a complete day around it to be a valid observation, so shortened and holiday sessions are included here. Restricting to complete sessions gives 40,716 candles and a median of 28.5 points; the conclusion is unchanged. Hours.
- Median, not averageStated above, and both figures are published so you can use whichever you prefer.
- What is excludedNo candle is removed for being quiet, wild, thin or inconvenient, and no session is excluded from this study. The only rows dropped anywhere are duplicate timestamps and bars after the cutoff, both counted in the audit.
What this does not prove
The high-to-low range of a candle is not the adverse excursion a trade would have experienced. An entry sits somewhere inside that range rather than at its most favourable edge, so a candle covering 28 points does not mean a trade in it was 28 points offside.
It describes the period measured, not the future. Volatility regimes change, and a quiet quarter or a violent one would move these numbers. Nothing here predicts direction, and nothing here makes a trade more likely to work. It is also not a recommendation to widen your stop, a wider stop is a larger loss when it is hit, and the position size has to answer for that.
What to do with it
The usable version of this finding is not a number to memorise. It is a comparison to run on your own stop, at the hour you actually trade, on the instrument you actually trade. That takes about a minute.
Where does your stop sit in the distribution?
The tables above are the whole measurement. This puts one number of yours next to them: your stop, against the middle candle at the hour you actually trade, and against the share of candles that covered more ground than that.
The same question, worked all the way through
The free risk check takes this further than one comparison: your account, your stop and what a single trade costs you in room, side by side with the measured range. It is the first chapter of the kit and it costs nothing.
Risk & Drawdown Playbook
A candle range is one measurement. The kit is the six that decide an evaluation, each one a tool you type your own account into, with the prop firm rules that shrink your room applied on top.