The answer first
Which sounds like the day is close to done. It is not. Here is the number that has to sit beside it, and it is a straight count of sessions rather than anything derived:
Most of the range is usually built early. The range being finished early is rare.
Why those two numbers disagree
A session that has built 71% of its range by 11:00 still has to produce the other 29%, and that last stretch is what decides where the high and the low finally sit. Building most of a range is a statement about size. Finishing it is a statement about both extremes being already printed, and those come apart.
The gap closes slowly, and it does not close where people expect:
- At 13:00 the median session has built 90.2% of its range, and 32.3% of sessions are finished.
- At 14:30 the median reaches 100%, and 52.6% of sessions are finished. Those are two different facts about the same moment.
- At 15:30, with half an hour left, 28.9% of sessions have still not printed their final high or their final low.
The full picture
The first block is how much of the range exists, for the median session. The second block is a count: the share of sessions where the range was already complete. They are measuring different things and they are drawn apart for that reason.
Both instruments, every half hour
ES builds its range slightly later than NQ at every single mark. The shape is the same and the levels are a few points apart, which is the same relationship the range study found.
| By this time | NQ median share built | NQ sessions finished | ES median share built | ES sessions finished |
|---|---|---|---|---|
| 10:00 | 47.1% | 3 of 523 | 39.6% | 2 of 504 |
| 10:30 | 62.6% | 18 of 523 | 54.2% | 11 of 504 |
| 11:00 | 71.3% | 47 of 523 | 64.8% | 28 of 504 |
| 11:30 | 77.5% | 86 of 523 | 71.3% | 47 of 504 |
| 12:00 | 82.8% | 116 of 523 | 77.4% | 68 of 504 |
| 12:30 | 86.8% | 145 of 523 | 81.8% | 99 of 504 |
| 13:00 | 90.2% | 169 of 523 | 86.9% | 126 of 504 |
| 13:30 | 94.0% | 204 of 523 | 90.7% | 170 of 504 |
| 14:00 | 97.6% | 240 of 523 | 95.6% | 210 of 504 |
| 14:30 | 100.0% | 275 of 523 | 99.2% | 248 of 504 |
| 15:00 | 100.0% | 315 of 523 | 100.0% | 298 of 504 |
| 15:30 | 100.0% | 372 of 523 | 100.0% | 347 of 504 |
One session, worked in full
So that every figure above can be checked by hand rather than taken on trust, here is the single NQ session whose range is closest to the median of all 523.
- 2025-05-06, 390 one-minute bars. Open 19795.50, close 19875.75.
- High 20026.25 at 12:14, low 19739.00 at 10:00. The final range is 287.25 points.
- By 11:00 the range so far was 198.75 points, which is 69.2% of the final range.
- By 13:00 it reached 287.25, the full figure. This session was one of the 169 that were finished by 13:00.
Method
- The two measurementsFor each session we take the final range, the highest high minus the lowest low across the whole session. Then for each half hour mark we take the range built so far, using only bars before that time. Share built is one divided by the other, and the figure reported is the median across sessions. Finished is a separate test: the range so far equals the final range, counted as a plain yes or no per session. The finished percentages are counts, not anything read off the median.
- Why both are publishedAn earlier draft of this study reported only the medians and said that more than half of sessions were finished by 14:30, reading that off the median reaching 100%. The count says 52.6% on NQ and 49.2% on ES, so on ES the claim was simply false. The count is now measured directly and both are shown.
- Window edges"By 11:00" means bars from 09:30 up to but not including 11:00.
- Data cutoff: 17 Sep 2026This study is versioned and frozen at that date. Figures are revised as a new version with its own cutoff, never continuously.
- DataTrade ticks exported through Quantower for XCME-listed instruments, aggregated into one-minute bars by our own code, with recent days taken from the desk’s own live recordings. The methodology page carries the chain from the export onward, the row by row audit, and the part of the chain we cannot show. Rows sharing an identical bar timestamp are collapsed, keeping the first occurrence.
- SessionThe US cash session, 09:30 to 16:00 New York. NQ trades on CME almost around the clock, so this is a chosen window rather than the instrument’s own trading hours. Overnight is excluded entirely, and an overnight gap is therefore invisible to every figure here.
- What counts as a sessionA session is included only if it carries at least 300 of the 390 regular-hours minutes, which drops half days and holiday sessions. That leaves 523 NQ and 504 ES sessions. This is a looser rule than study 02 uses, because study 02 asks exactly when an extreme was printed and a missing stretch could have contained it. Nothing here depends on a single minute in that way.
- TiesWhere an extreme value occurs on more than one bar, the first occurrence is used.
- The codeOne script produces every figure on this page, and the same script produces studies 04, 05 and 06 so that the three cannot disagree about the session list. Each measurement carries, in the code itself, a written statement of what it does not measure.
What this does not prove
This study knows where the session’s two extremes sit in time. That is all it knows, and the tempting next step is not supported by it.
It does not say how much movement is left. A session can print both of its extremes by 11:00 and then move a great deal inside them for the rest of the day. Nothing here measures distance covered after any time of day, so no figure on this page supports a claim about how much is left to trade, how much opportunity remains, or whether the afternoon is worth sitting for.
It does not say anything about direction. Which extreme came first, which way the session then went, and whether either level held are all outside the measurement.
It describes the period measured. Two years is enough to be meaningful and not enough to be permanent. A different volatility regime would move these figures, which is why the study is versioned rather than continuously updated.
How much of the range was built before you sat down?
Pick the instrument and the time you actually start. The tool reports the two measured figures for that moment and nothing else: how much of the range the median session had built, and how many sessions were already finished.
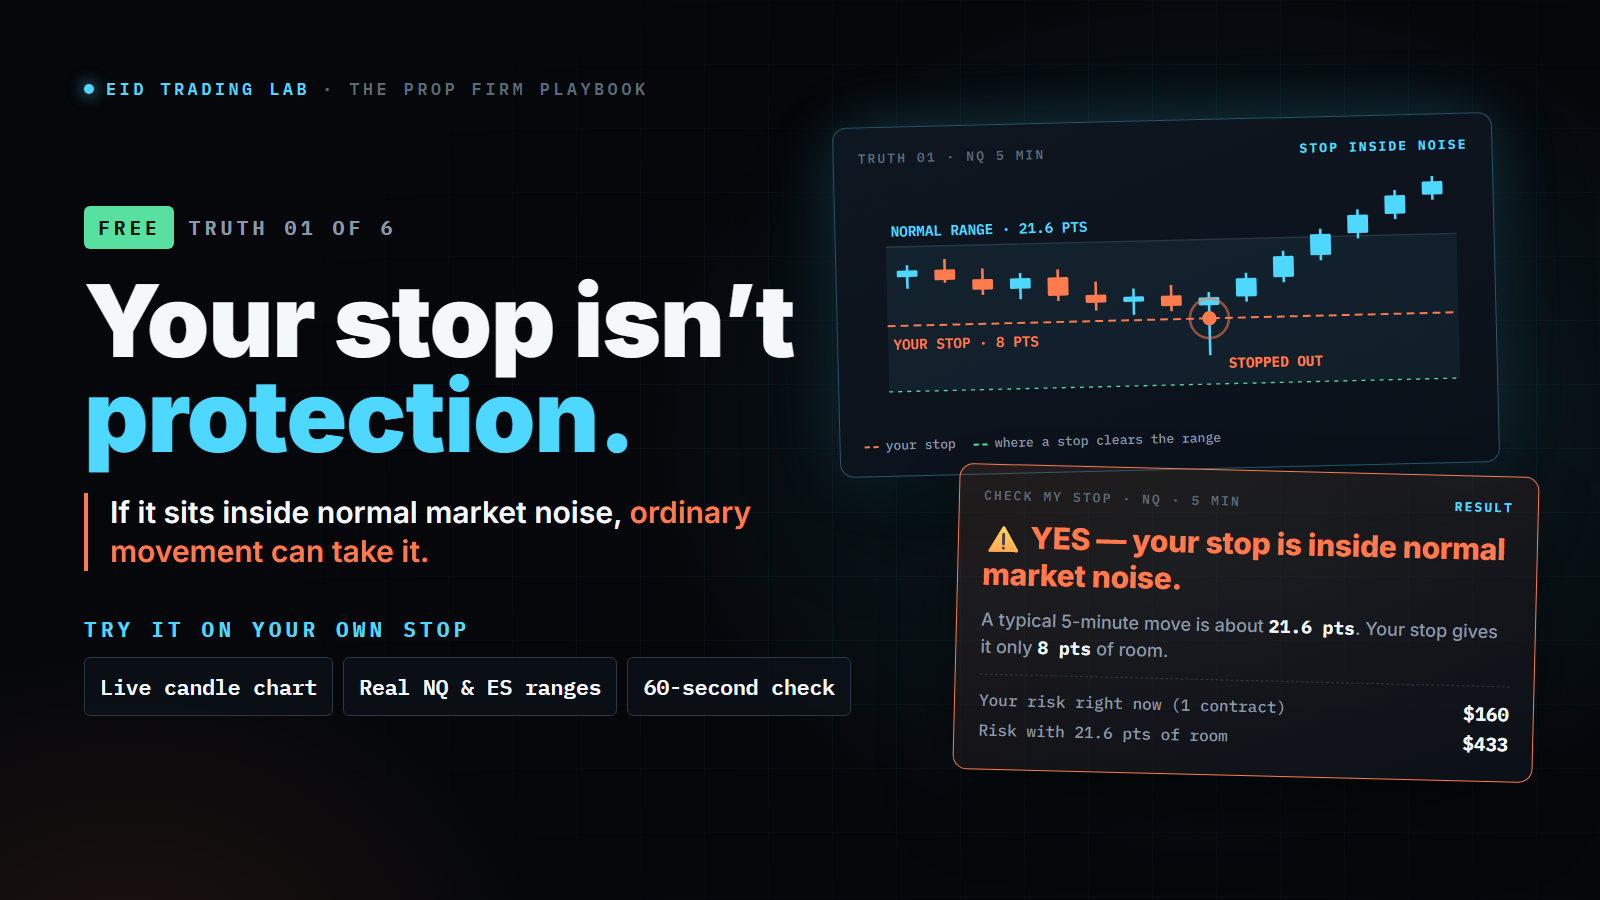
Get the free risk check
The free risk check puts your own account and your stop next to the measured range of a five minute candle on the instrument you trade. It runs in the page, and it costs nothing.
Double opt-in: one confirmation email first, and the check opens after you confirm.
No spam · unsubscribe in one click · we never sell or share your address.
Rather just look first? Open the free risk check.
Related
Study 02 asks a neighbouring question and answers it differently: it times each extreme separately, and finds that one of the two is usually in place within the first hour while both almost never are. This study asks how much of the range exists, which is a question about size rather than timing. Read together they say that the early session usually sets one edge and most of the width, and usually does not set the day.