The answer first
In points, on the median NQ session, that is a range of 287.25 and an open-to-close move of 135.25. ES gives almost the same ratio on a completely different point scale: 47.9%, from a range of 59.75 and a move of 26.75.
Roughly half the width of the day is the part that does not show up between the open and the close.
The spread around that median
A median on its own hides the shape, and the shape here is wide. These are straight counts of sessions, not anything derived from the median.
- 120 of 523 NQ sessions (22.9%) finished within a quarter of their range of where they opened.
- 271 (51.8%) finished within half of it, which is what puts the median where it is.
- 97 (18.5%) finished more than three quarters of their range away from the open.
Both instruments
The two agree closely on all three thresholds, which is worth noting because they are different contracts at different point scales. ES has slightly more sessions in the low bucket and fewer in the high one.
| Open to close, as a share of the session range | NQ | ES |
|---|---|---|
| Median session | 47.5% | 47.9% |
| Sessions under 25% | 120 of 523 | 130 of 504 |
| Sessions under 50% | 271 of 523 | 266 of 504 |
| Sessions over 75% | 97 of 523 | 75 of 504 |
| Median range, in points | 287.25 | 59.75 |
| Median open-to-close move, in points | 135.25 | 26.75 |
One session, worked in full
The same NQ session used in study 04, so the two pages can be checked against each other.
- 2025-05-06. Open 19795.50, close 19875.75, high 20026.25, low 19739.00.
- Range: 20026.25 minus 19739.00 is 287.25 points.
- Open to close: 19875.75 minus 19795.50 is 80.25 points.
- 80.25 divided by 287.25 is 27.9%. This session sits in the under-50% group.
Method
- The measurementFor each session, the absolute value of the last close minus the first open, divided by the highest high minus the lowest low. One number per session. The figure reported is the median across sessions, and the three thresholds are straight counts.
- It does not depend on bar sizeEvery input is a session-level open, high, low or close, so the same sessions measured on ticks or on hourly bars would give identical figures. This is deliberate. An earlier draft of this study reported a path length instead, summing every one-minute move, and that number changes entirely with the bar size it happens to be measured on. It was dropped for that reason.
- Sessions with no rangeA session whose high equals its low would divide by zero. None occurred, and the code drops them if they do.
- Direction is discardedThe numerator is an absolute value, so a session that closed 100 points up and one that closed 100 points down are the same measurement here. Direction is study 06.
- Data cutoff: 17 Sep 2026This study is versioned and frozen at that date. Figures are revised as a new version with its own cutoff, never continuously.
- DataTrade ticks exported through Quantower for XCME-listed instruments, aggregated into one-minute bars by our own code, with recent days taken from the desk’s own live recordings. The methodology page carries the chain from the export onward, the row by row audit, and the part of the chain we cannot show. Rows sharing an identical bar timestamp are collapsed, keeping the first occurrence.
- SessionThe US cash session, 09:30 to 16:00 New York. NQ trades on CME almost around the clock, so this is a chosen window rather than the instrument’s own trading hours. Overnight is excluded entirely, and an overnight gap is therefore invisible to every figure here.
- What counts as a sessionA session is included only if it carries at least 300 of the 390 regular-hours minutes, which drops half days and holiday sessions. That leaves 523 NQ and 504 ES sessions. This is a looser rule than study 02 uses, because study 02 asks exactly when an extreme was printed and a missing stretch could have contained it. Nothing here depends on a single minute in that way.
- TiesWhere an extreme value occurs on more than one bar, the first occurrence is used.
- The codeOne script produces every figure on this page, and the same script produces studies 04, 05 and 06 so that the three cannot disagree about the session list. Each measurement carries, in the code itself, a written statement of what it does not measure.
What this does not prove
This measure knows where a session started, where it ended, and how wide it got. It does not know the route between those points, and almost every tempting reading of it is a claim about the route.
It is not a give back, a retracement or a reversal. Those words all describe price reaching somewhere and coming off it, which requires knowing the order in which things happened. Nothing here is ordered in time. Two sessions with an identical 30% separation can have taken completely different routes, and this study cannot tell them apart.
It is not distance travelled. The range is a width, not the length of a journey. A session that oscillated inside a narrow band all day and one that went straight up and straight back down can produce the same range.
It is not profit, loss or opportunity. It is a property of price. It says nothing about what any position in it would have been worth, because it does not know when anyone entered or which way.
It describes the period measured. Two years, versioned and frozen rather than continuously updated.
Measure one of your own sessions
Enter the four session figures for a day you traded. The tool runs the same division on them and places the result against the sessions this study measured. Nothing is stored and nothing leaves the page.
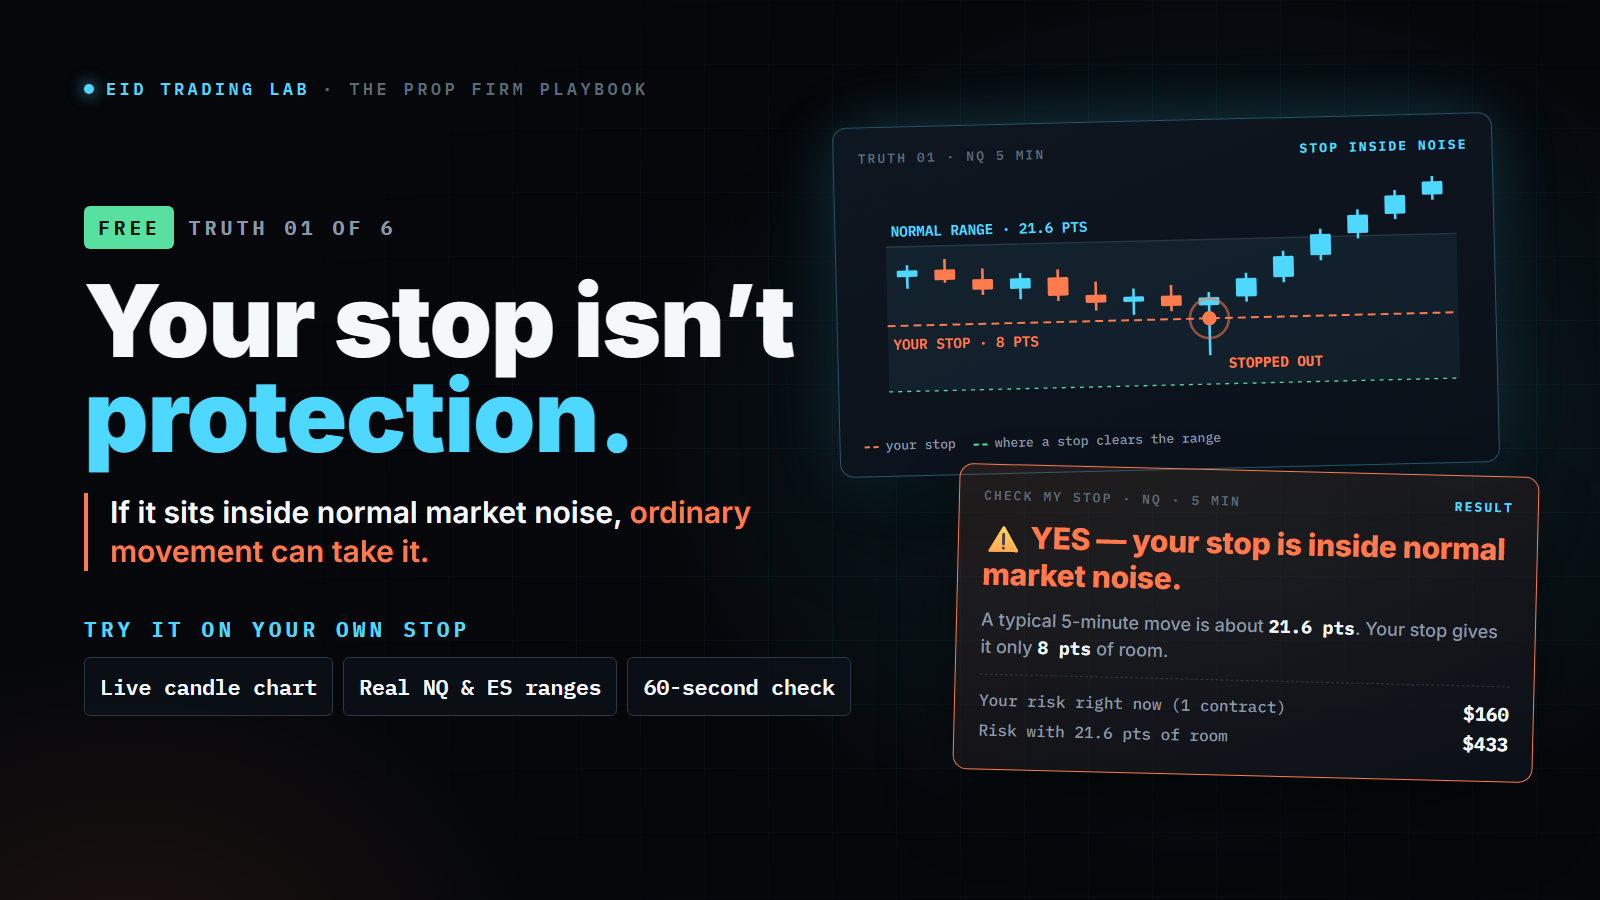
Get the free risk check
The free risk check puts your own account and your stop next to the measured range of a five minute candle on the instrument you trade. It runs in the page, and it costs nothing.
Double opt-in: one confirmation email first, and the check opens after you confirm.
No spam · unsubscribe in one click · we never sell or share your address.
Rather just look first? Open the free risk check.