EID Firm Profiles
Choose your account.
The tool fills itself in.
Most people give up at the first box, because knowing what your drawdown actually is means going and finding your contract. Pick your plan and the boxes are already filled, from the firm’s own page, with the date it was checked on screen. Then change anything that is different on your account. The answer follows the boxes, never the profile.
Seven plans so far, all at the evaluation stage. See what is in each profile, or enter your own numbers and ignore the list entirely.
We test what traders are told to believe. Here is one of those tests. Move the stop and see for yourself.
Experiment 01: Stop vs 5-Minute Range
InteractiveIllustrative price path, not market data. The 28-point envelope and every statistic shown are measured from 747,455 historical NQ 1-minute bars.
The median is the middle value. Line up every 5-minute NQ candle from the smallest move to the biggest, and the one in the middle covered 28 points. So half of them moved more than that, and half moved less.
It is not an average. One wild CPI morning can pull an average upward until it describes no ordinary day at all. The median stays where most candles actually are.
Drag the slider to your own stop size. The percentage is arithmetic on a measured figure, not a verdict on your trading.
The Prop Firm Playbook
Four interactive Lab Kits, built on the same measured research. Each one runs on numbers you enter.
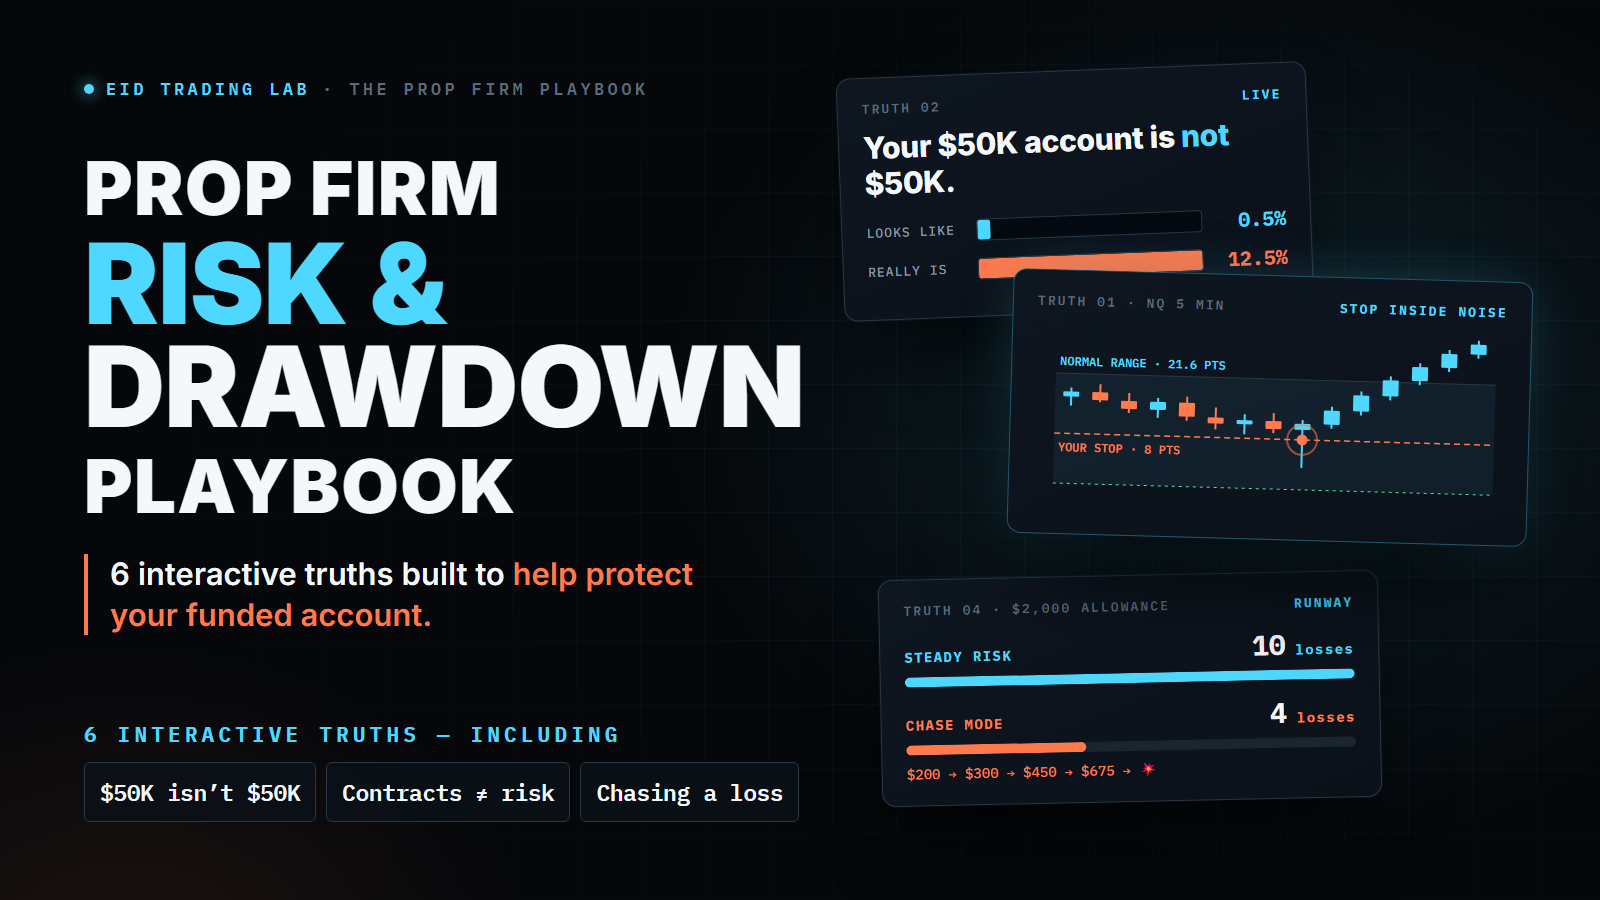 Lab kit 01
Risk & Drawdown
Where your stop sits against the measured range, and what a drawdown rule really leaves you.
$39Get it →
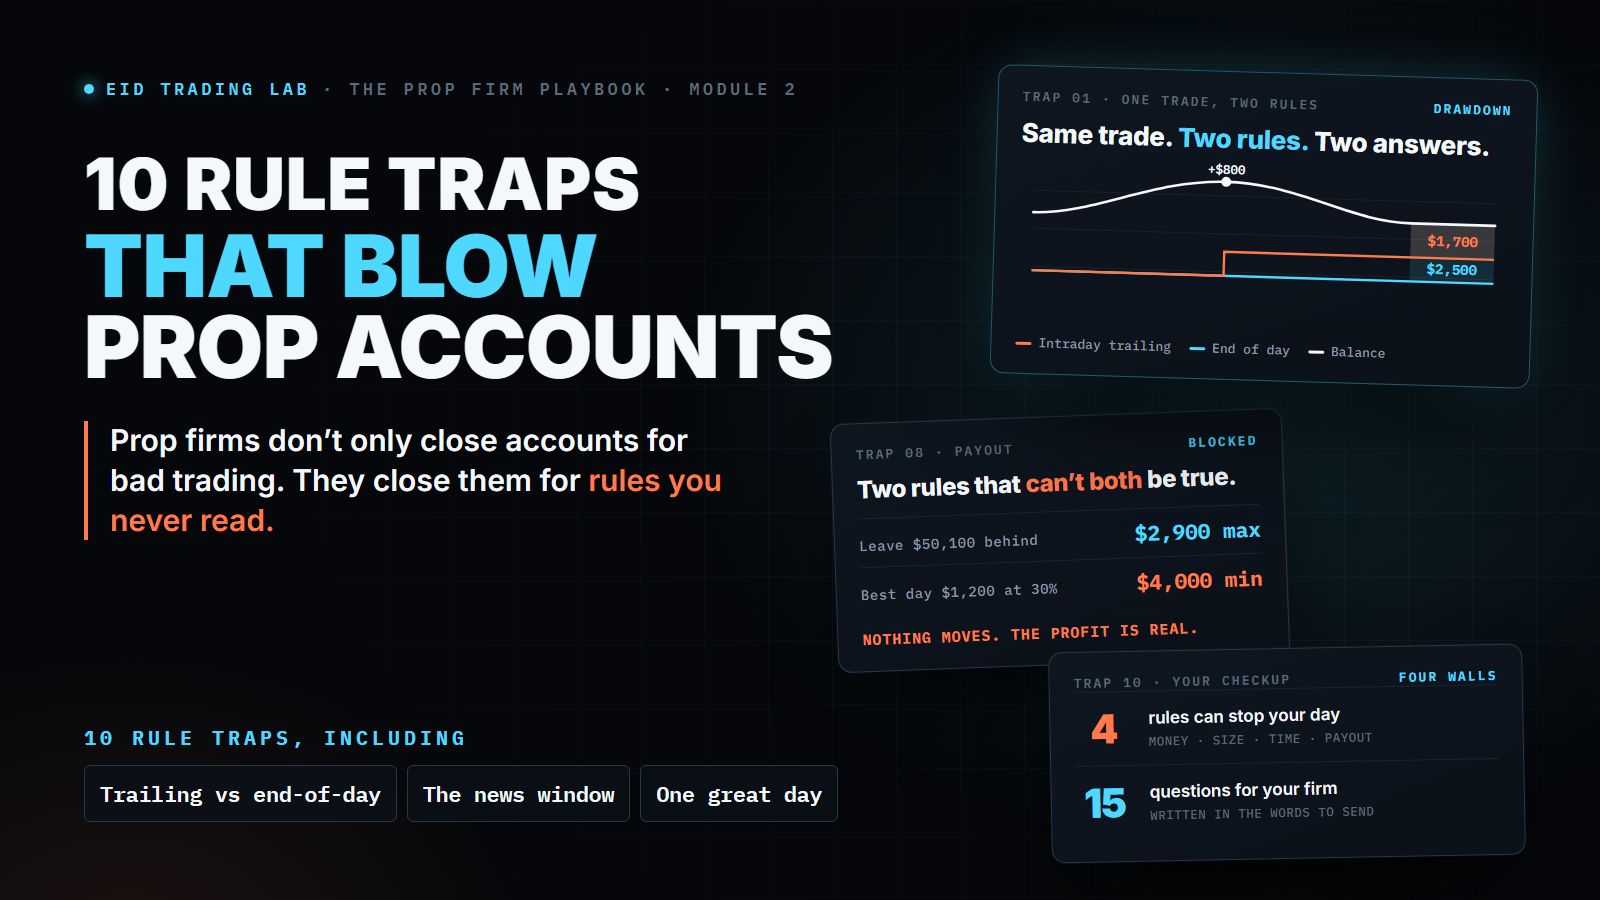 Lab kit 02
Prop Firm Rule Traps
Ten evaluation rules taken apart, reading from your own firm’s rule profile.
$49Get it →
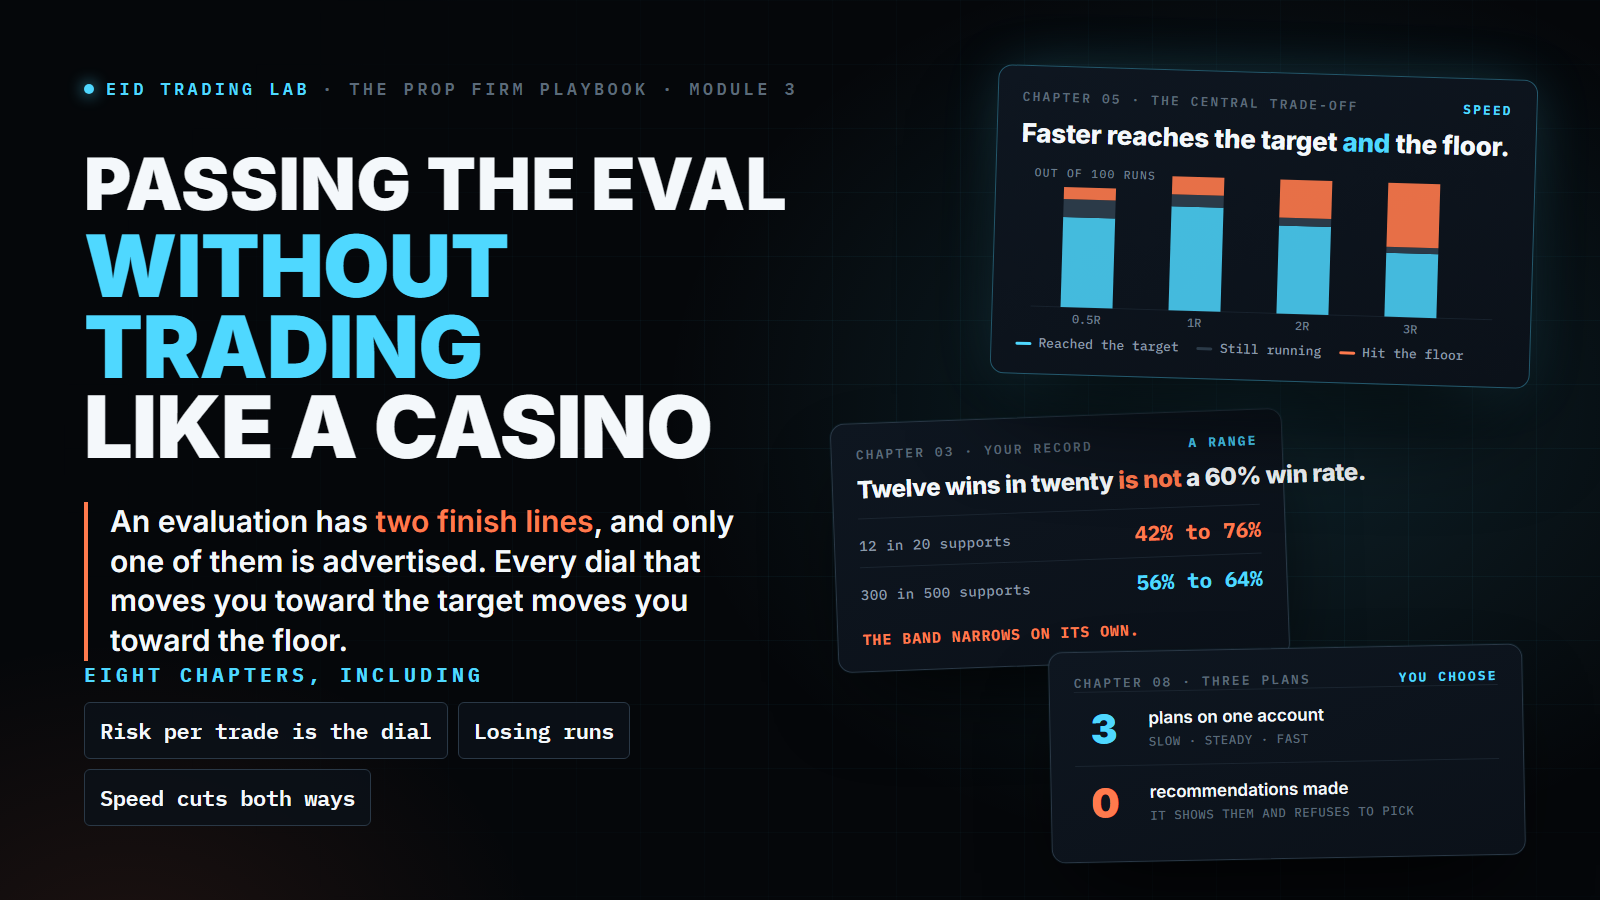 Lab kit 03
Passing the Eval
What trying to pass faster costs. Three plans compared, none of them recommended.
$49Get it →
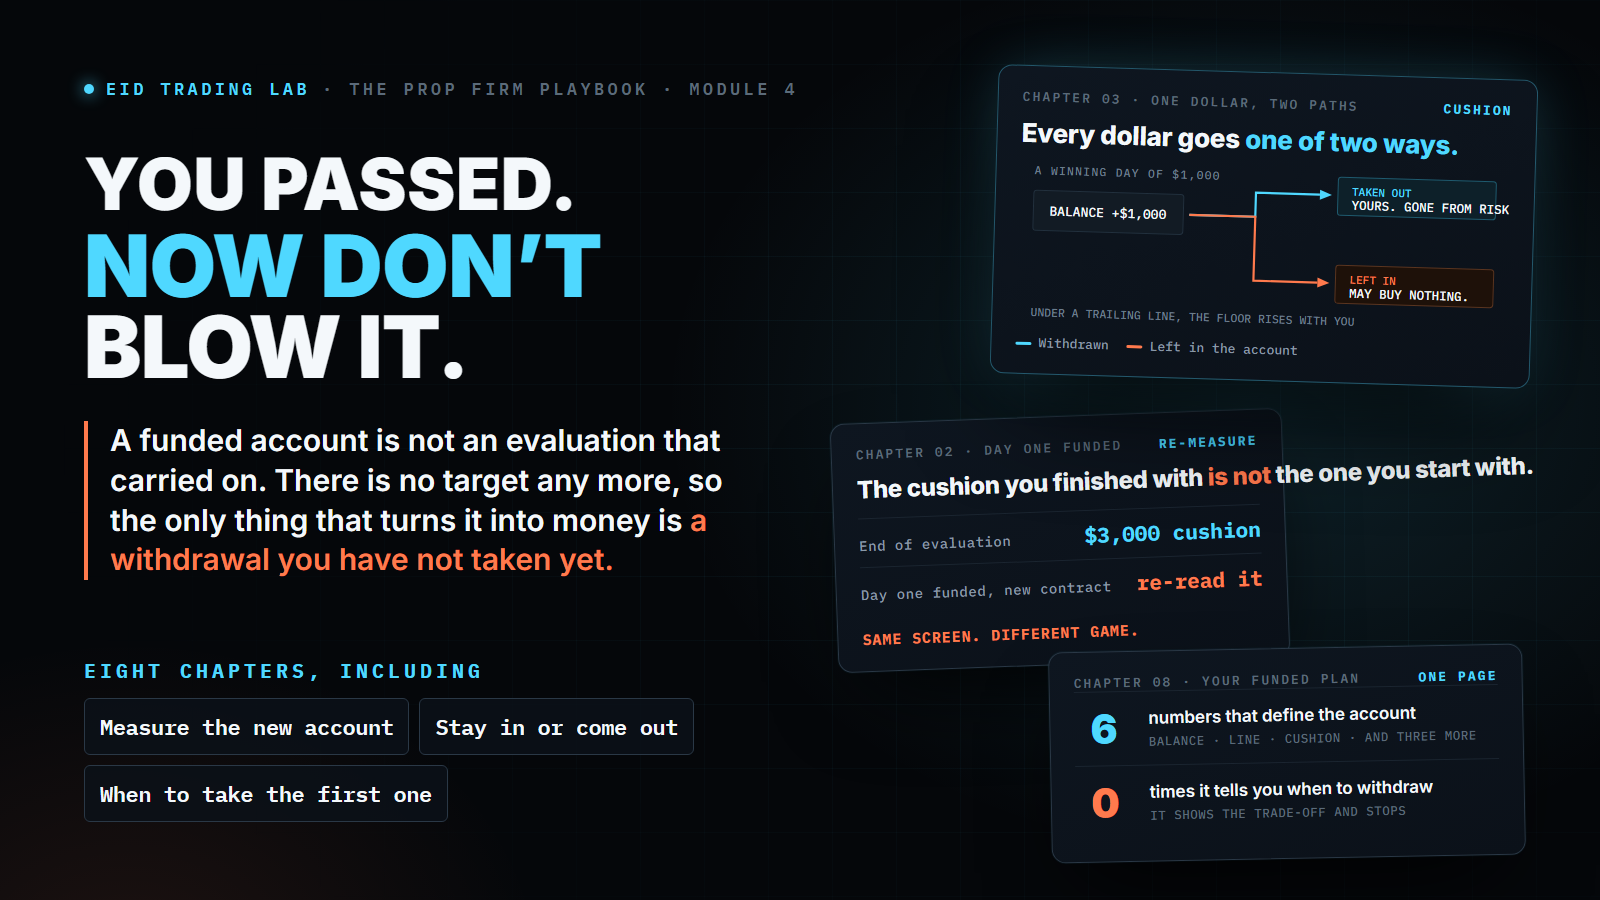 Lab kit 04
You Passed. Now What.
The funded account and the payout, on your contract and your own withdrawal policy.
$49Get it →
All four together: $149 instead of $186. One payment, no subscription.
The data
The finding
“25 points” is not 25 points.
Your stop is always 25 points. The middle value, the median, of how far a 5-minute NQ candle travels is not always the same. It is largest at the open and smallest around lunch. So the same stop is a different share of that measured range at every hour.
Line up every 5-minute candle in that half hour from the smallest move to the biggest and take the one in the middle. Half covered more ground than that, half covered less.
We use it instead of an average because one violent morning drags an average up to a number no ordinary candle ever visits. The median stays where most candles actually are.
Scroll to move through the session.
How the lab works
We write down the claim.
In plain words, so it can actually be tested. If it can't be measured, it isn't a claim, it's a slogan.
We measure it.
Against every regular-session 5-minute candle in the period, with any exclusions stated openly rather than quietly applied.
We publish the number.
With the method, the sample size and the date range attached, and with what it does not prove written next to it.
We turn it into a tool.
A number you can run against your own stop and your own account is worth more than a number you read once.
“A 10-point stop on NQ is tight.”
“Just be disciplined.”
One of these can be tested.
747,455 NQ 1-minute bars · 548 sessions.
Median high-to-low range of one 5-minute NQ candle, regular session. Not a claim about any individual trade.
The free check, running on your numbers.
Keep reading
Limits
Where we stop.
Research notes
Get the measurements as they are published.
Four short emails to start: the free risk check, the 28-point finding and what it changes about stop placement, one prop firm rule trap with the arithmetic shown, and what the paid playbook adds that the free material does not.
DOUBLE OPT-IN: WE SEND ONE CONFIRMATION EMAIL FIRST. THE TOOL OPENS AFTER YOU CONFIRM.
NO SPAM · UNSUBSCRIBE IN ONE CLICK · WE NEVER SELL OR SHARE YOUR ADDRESS
AFTER THE FIRST FOUR EMAILS WE ONLY WRITE WHEN THERE IS A NEW STUDY, TOOL OR RULE BREAKDOWN.
The free risk check, and one line on what the lab does.
The 28-point finding, and why the median range changes how a stop reads.
One prop firm rule trap, with the numbers worked through.
What the playbook adds that the free material does not.