The answer first
That gap is the largest one in the whole table, and it is four runs over two years. At every other length the measured count and the coin’s count sit on top of each other. And the single figure people reach for first goes the other way:
NQ’s longest streak in two years was shorter than the one a coin would usually have given you.
Every run length, against chance
The measured row is a count of how many times a run of that length or longer occurred. The coin row is the average of the same count over 20,000 simulated sequences of 523 independent fair coin flips.
| Run length, NQ | Times it happened | Times a fair coin gives |
|---|---|---|
| 2 sessions or more | 126 | 130.7 |
| 3 sessions or more | 68 | 65.3 |
| 4 sessions or more | 34 | 32.5 |
| 5 sessions or more | 20 | 16.3 |
| 6 sessions or more | 7 | 8.1 |
| 7 sessions or more | 4 | 4.0 |
| 8 sessions or more | 1 | 2.0 |
ES says the same thing
Run for run, on a different contract over a slightly different window, with the same result. The one visible gap is at six sessions or more, where ES produced 3 and a coin gives 7.8, which is again the market being less streaky than chance rather than more.
| Run length, ES | Times it happened | Times a fair coin gives |
|---|---|---|
| 2 sessions or more | 123 | 126.0 |
| 3 sessions or more | 65 | 62.9 |
| 4 sessions or more | 32 | 31.4 |
| 5 sessions or more | 17 | 15.7 |
| 6 sessions or more | 3 | 7.8 |
Why this matters more than a finding would
A study that confirms a pattern gives you something to act on. This one takes something away, and that is the more useful direction here, because the belief it removes is expensive.
Counting runs without a benchmark is the trap. Twenty runs of five sessions sounds like a lot until you learn chance alone produces about sixteen. The human eye finds streaks in random sequences reliably, so a streak count on its own is not evidence of anything. The comparison is the study.
This does not say the market is random. It says that this particular measurement, the direction of consecutive daily closes against their own opens, does not distinguish it from a coin. A different measurement could well find structure, and several of the other studies here do find it.
Method
- DirectionThe sign of the session close minus the session open. Up, down, or exactly equal. Note that this is the session’s own open, not the previous session’s close, so an overnight gap does not count as part of the day’s direction.
- A runA maximal block of consecutive sessions with the same non-zero direction. A session that closed exactly at its open ends the run it interrupts and starts none; there were 3 such sessions on NQ and 3 on ES.
- ConsecutiveConsecutive sessions in the data, so a weekend or a holiday does not break a run. A session dropped for having too few bars would break one, and this is a limitation rather than a choice.
- The benchmark20,000 simulated sequences of independent fair coin flips, one per session, seeded so the figures reproduce exactly. The same run-counting code runs on the measured sequence and on every simulated one, so the two columns cannot differ because of how they were counted.
- Why a fair coinBecause it is the simplest thing that could produce these runs. NQ closed up on 276 of 523 sessions, which is 52.8%, close enough to even that a fair coin is the right null. A coin weighted to 52.8% would produce slightly more runs, which would narrow the gaps further rather than widen them.
- Data cutoff: 17 Sep 2026This study is versioned and frozen at that date. Figures are revised as a new version with its own cutoff, never continuously.
- DataTrade ticks exported through Quantower for XCME-listed instruments, aggregated into one-minute bars by our own code, with recent days taken from the desk’s own live recordings. The methodology page carries the chain from the export onward, the row by row audit, and the part of the chain we cannot show. Rows sharing an identical bar timestamp are collapsed, keeping the first occurrence.
- SessionThe US cash session, 09:30 to 16:00 New York. NQ trades on CME almost around the clock, so this is a chosen window rather than the instrument’s own trading hours. Overnight is excluded entirely, and an overnight gap is therefore invisible to every figure here.
- What counts as a sessionA session is included only if it carries at least 300 of the 390 regular-hours minutes, which drops half days and holiday sessions. That leaves 523 NQ and 504 ES sessions. This is a looser rule than study 02 uses, because study 02 asks exactly when an extreme was printed and a missing stretch could have contained it. Nothing here depends on a single minute in that way.
- TiesWhere an extreme value occurs on more than one bar, the first occurrence is used.
- The codeOne script produces every figure on this page, and the same script produces studies 04, 05 and 06 so that the three cannot disagree about the session list. Each measurement carries, in the code itself, a written statement of what it does not measure.
What this does not prove
The single most important thing on this page is what this study is not about, because the words overlap almost exactly with something else.
This is not a trader’s losing streak, and it is not a strategy’s. A run of five down sessions is five days the market closed below its own open. It is not five losing trades and not five losing days for anyone. It says nothing about which direction anyone was positioned, when they entered, when they exited, or how large they were. A trader could have made money on all five. The two things are different categories and the figures here are not evidence about the other one.
It does not say the market is random. It says this one measurement does not separate it from a coin. That is a much narrower claim.
It does not support a bet either way. Neither that a streak will continue nor that it is due to end. Both of those are claims about what comes next, and nothing here was measured forward.
It describes the period measured. Two years, versioned and frozen rather than continuously updated.
How unusual is the run you are looking at?
Pick a run length and the tool gives you the two counts side by side: how many times it actually happened, and how many times chance alone would have produced it over the same number of sessions.
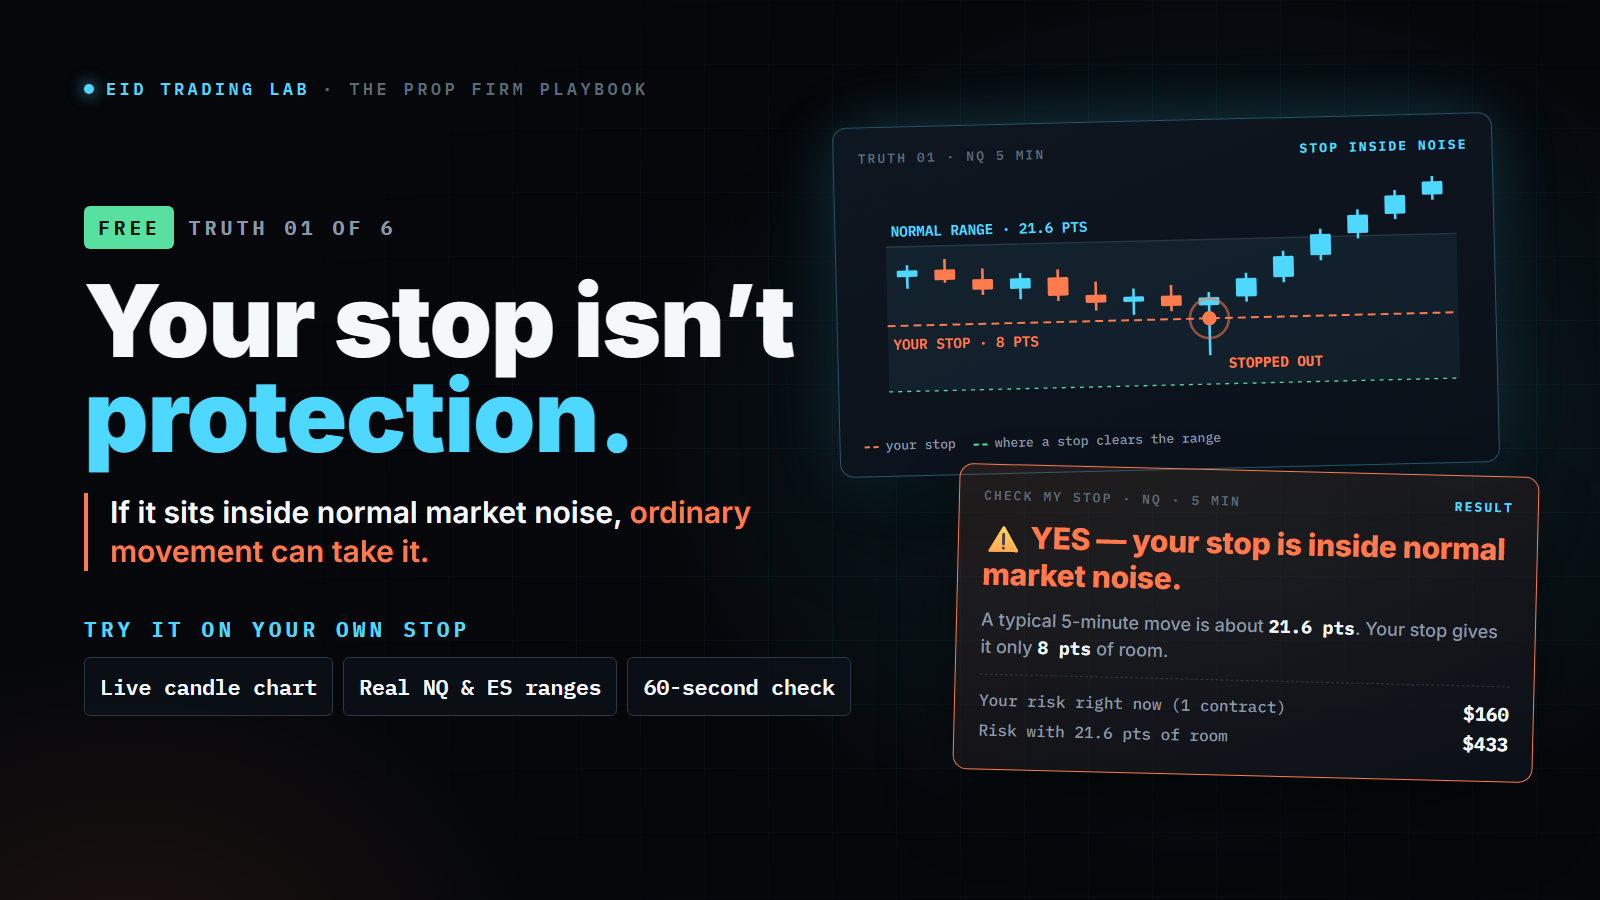
Get the free risk check
The free risk check puts your own account and your stop next to the measured range of a five minute candle on the instrument you trade. It runs in the page, and it costs nothing.
Double opt-in: one confirmation email first, and the check opens after you confirm.
No spam · unsubscribe in one click · we never sell or share your address.
Rather just look first? Open the free risk check.
Related
Study 05 measures the size of the same open-to-close move this study only takes the sign of. Together they say that the direction of a session tells you little on its own, and that the distance between where a day opens and where it ends is only about half its width.